

Installation
Insertion Loss vs Return Loss: Formulas and Limits
Every fiber optic datasheet prints two dB numbers, and they trip up more technicians than any other spec on the page: insertion loss vs return loss. They sound like the same measurement, but they point in opposite directions. Insertion loss tells you how much of the light fails to get through a connector, splice, or link — a lower number is better. Return loss tells you how much light bounces back toward the transmitter — a higher number is better. Get the direction wrong on an acceptance test and you can reject a perfectly good link, or pass one that will haunt you at 3 a.m. This guide gives you the definitions, the formulas behind the dB values, and the pass/fail numbers used in the field, and it fits inside the larger fiber optic installation, splicing, and testing field handbook on this site.
Insertion Loss vs Return Loss at a Glance
If you only have sixty seconds, the table below is the whole story. Every row is unpacked further down the page.
Insertion loss (IL) | Return loss (RL) | |
|---|---|---|
What it measures | Light power lost traveling through a link or component | Light power reflected back toward the source |
Formula | 10·log₁₀(P_in/P_out), positive dB | 10·log₁₀(P_in/P_r), positive dB |
A "good" value is | Low (0.2 dB beats 0.5 dB) | High (60 dB beats 30 dB) |
Main causes | Fiber attenuation, splices, connectors, bends, contamination | Refractive-index mismatches, air gaps, end-face contamination, poor polish |
Measured with | Light source + power meter (OLTS), Tier 1 | OTDR reflectance / ORL meter, event level |
What it hurts when bad | Received power drops below receiver sensitivity | Laser instability, ghost reflections, added noise |
One line to remember: insertion loss is about the light that does not arrive, return loss is about the light that comes back. The same two metrics govern copper cabling too — Fluke Networks' overview of insertion loss and return loss as performance parameters covers both media if you certify twisted pair as well as fiber.
What Is Insertion Loss? Definition, Formula, and Causes
Insertion loss (IL) is the optical power lost as light travels from one point to another — through a mated connector pair, a splice, or an entire fiber link. It is expressed in decibels (dB) as a positive number, because the output power is always smaller than the input power.
$$IL(dB) = 10 \cdot \log_{10}\left(\frac{P_{in}}{P_{out}}\right) = -10 \cdot \log_{10}\left(\frac{P_{out}}{P_{in}}\right)$$
Where P_in is the power launched into the component or link and P_out is the power that comes out the other end. Most readers of this guide care about fiber insertion loss specifically, so the numbers below use fiber values — but the definition is the same for any optical or electrical path.
Decibels hide ratios, so a worked example helps. An insertion loss of 0.5 dB means P_out/P_in = 10^(−0.05) ≈ 0.89: about 89% of the light arrives and 11% does not. A mated connector pair at 0.3 dB lets roughly 93% through. That is why low-loss components matter on long links: every 0.1 dB you save at each of a dozen connections is more than 1 dB of extra margin at the receiver. And in case the question is on your mind: is higher insertion loss better? No. The scale runs opposite to return loss — lower insertion loss is always better, because the goal is for more light to arrive.
Insertion loss comes from four places:
- Fiber attenuation — the intrinsic loss of the glass, roughly 0.35–0.4 dB/km at 1310 nm singlemode and 3.0–3.5 dB/km at 850 nm multimode.
- Connectors — each mated pair adds loss from core misalignment, gap, and end-face quality.
- Splices — fusion splices add a few hundredths of a dB; mechanical splices add more.
- Bends, dirt, and damage — macrobends, microbends, and contaminated end faces can add loss far above the component's rated value.
When measured insertion loss is higher than the component's spec, the cause is almost never the factory rating. It is an installation problem — usually dirt, a bad cleave, an over-tight bend, or an APC connector forced into a UPC adapter.
What Is Return Loss? Definition, Formula, and Why Higher Is Better
Return loss (RL) measures the light that reflects back toward the transmitter when it hits a discontinuity — a connector interface, a splice, a crack, or the end of the fiber. Fiber spec sheets quote fiber optic return loss as a positive dB number: the bigger it is, the less light is coming back.
$$RL(dB) = 10 \cdot \log_{10}\left(\frac{P_{in}}{P_r}\right) = -10 \cdot \log_{10}\left(\frac{P_r}{P_{in}}\right)$$
Where P_in is the incident power and P_r is the reflected power. Because P_r can never exceed P_in, RL is always positive — and if nothing at all reflects back, RL approaches infinity. A connector rated at 50 dB return loss reflects 10^(−50/10) = 0.001% of the light (one hundred-thousandth); one at 60 dB reflects 0.0001%.
Why does a technician care about a fraction of a percent of the light? Because of what it does when it gets back:
- Laser instability. Reflected light re-enters the laser cavity and can cause mode hopping, intensity noise, and a higher bit error rate. This matters most with the DFB lasers used in DWDM and RF-over-fiber links.
- Ghost signals. A strong reflection can bounce again at the far end and arrive as a delayed, weaker copy of the real signal.
- Double-counting in the budget. Reflected power never reaches the receiver, so a badly reflecting connection quietly steals margin the same way insertion loss does.
The physics behind connector reflections is Fresnel reflection: at a perpendicular glass-to-air interface, roughly 4% of the light bounces back — which is only about 14 dB of return loss, far too poor for any network. Polishing changes that. A PC (physical contact) end face still leaves a tiny perpendicular micro-gap; UPC (ultra-polished, blue) flattens the contact curve and pushes singlemode connector return loss to around 50 dB; APC (angled, green, 8°) tilts the end face so the reflected light is steered out of the core, reaching 60 dB or better.
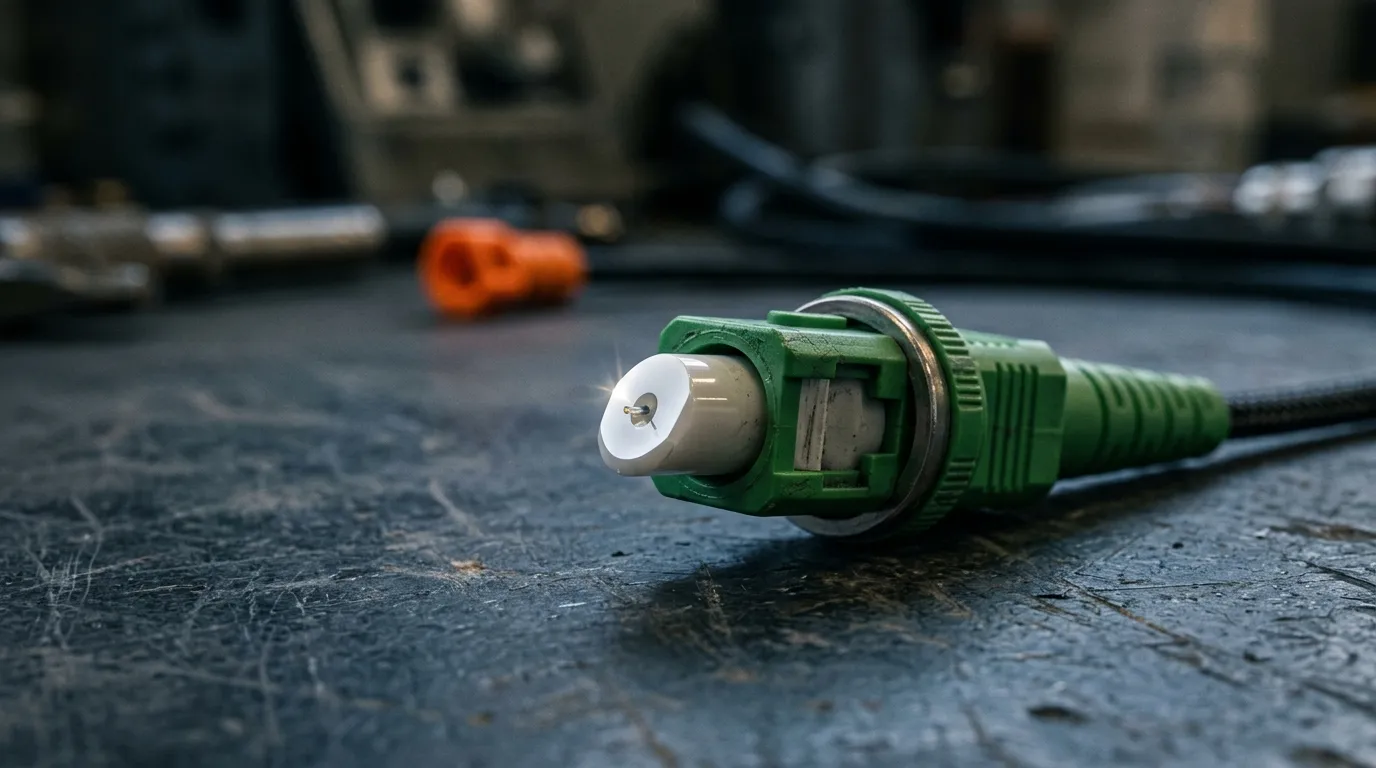
The trade-offs between the two polished grades are covered in our APC vs UPC connector comparison. For a whole link rather than one connector, the same ratio is called optical return loss (ORL). The definitions, sign conventions, and the Fresnel math behind all of this are spelled out in the Wikipedia entry on return loss.
Insertion Loss vs Return Loss: Same Joint, Two Different Measurements
Insertion loss and return loss happen at the same place — the connection — but they describe different physics, and one tells you almost nothing about the other.
Think of a mated connector pair as a toll booth on a highway. Insertion loss is the toll: a fixed cut of every car that passes. Return loss is the share of drivers who see the booth, turn around, and drive back toward you. A booth can be cheap (low IL) and still have a terrible turnaround rate (low RL) if the sign is confusing — in optics, if the end faces are angled wrong, gapped, or dirty. The two numbers are independent: it is entirely possible to measure excellent insertion loss on a mated pair whose return loss is poor, and vice versa. Contamination is the one cause that reliably degrades both at once — a speck of dust both blocks light (IL) and scatters it back (RL).
This is also where the sign conventions catch people. Some documents, and most OTDR readouts, express the reflected power as reflectance, which is the negative of return loss: a reflectance of −35 dB means exactly the same thing as a return loss of 35 dB. If you see a negative dB spike on an OTDR trace and your connector datasheet says "RL ≥ 50 dB," you are not looking at a contradiction — the trace is showing reflectance (−50 dB or better is the good direction), and the spec sheet is showing return loss (+50 dB or better is good). Fluke's explanation of return loss walks through the reflectance-versus-return-loss relationship in more detail.
One more context note: if you came from RF or copper testing, you have met the same physics as VSWR and S-parameters — return loss and voltage standing wave ratio describe the same mismatch, just in different units. In fiber, the mismatch is refractive index and geometry instead of impedance, but the "more reflection is worse" logic is identical.
Pass/Fail Limits: Connector, Splice, and Link Values
The question behind most searches — "how much return loss is acceptable?" — deserves a straight answer, and so does the insertion loss one. The honest version has three layers: component limits, splice limits, and the link budget.
Connectors (mated pair). The structured-cabling floor is set by TIA-568.3-D: no mated connector pair in a compliant channel may exceed 0.75 dB insertion loss, and the return loss minimums are 20 dB for multimode and 26 dB for singlemode PC-type connectors. Real products beat those floors by a wide margin — well-made factory-terminated LC and SC pairs measure 0.2–0.5 dB in the field, and singlemode UPC connectors are commonly rated ≥ 50 dB return loss with APC at ≥ 60 dB. Multifiber MPO connectors and field-terminated (mechanical-splice-on) connectors run closer to the 0.75 dB ceiling, which is why link designs budget them at the limit rather than at the typical value.
Joint type | Typical field value | Hard limit to remember |
|---|---|---|
Fusion splice | 0.02–0.1 dB | 0.3 dB max (TIA); most crews re-do > 0.1 dB |
Mechanical splice | 0.2–0.5 dB (method-normal) | 0.3 dB TIA ceiling where compliance applies; never judge against fusion numbers |
Mated connector pair (LC/SC, factory) | 0.2–0.5 dB | 0.75 dB max per pair (TIA-568.3-D) |
Mated MPO pair | 0.3–0.75 dB | 0.75 dB max per pair |
Splices. TIA-568.3-D caps any single splice at 0.3 dB, fusion or mechanical, and that is the compliance ceiling to remember. Real-world performance differs sharply between the methods: a good fusion splice lands between 0.02 and 0.1 dB, and most crews re-splice anything above 0.1 dB on singlemode work even though the standard allows 0.3. A mechanical splice is a different class of joint — 0.2 to 0.5 dB is normal — so never judge one against a fusion-splice acceptance number; accept it against its own spec and the 0.3 dB ceiling where the channel must comply. The full comparison of fusion splicing, mechanical splicing, and connectorization, including when each joint type is the right call, is in our joint-method comparison.
What about return loss as a link test? This is the point most guides get wrong. Return loss is a component and event specification, not a routine end-to-end link acceptance test. Tier 1 certification (the test that decides pass/fail on a structured cabling job) measures insertion loss, length, and polarity — it does not measure link return loss, because the reflections from several connectors along a link do not simply add up the way losses do. You check connector return loss at the factory spec level and you watch reflectance events on an OTDR during troubleshooting; you do not fail a whole link because its aggregate RL reads 35 dB when nothing in the design required a link-level number. If a customer spec genuinely requires ORL on the completed link, it will say so explicitly — measure it with an ORL meter or OTDR per that spec, not by default.
Measuring Insertion Loss: OLTS and Tier 1 Testing
Insertion loss measurement on an installed link is a Tier 1 job, done with an optical loss test set (OLTS) — a light source on one end and a power meter on the other, or a single combined unit. The procedure is: set the reference (zero the meter through your launch reference cords), connect the link under test, and read the total loss in dB. The most common reference method is the one-jumper method, which deliberately includes the loss of the connector at each end of the link — because that is how the link will actually be used.
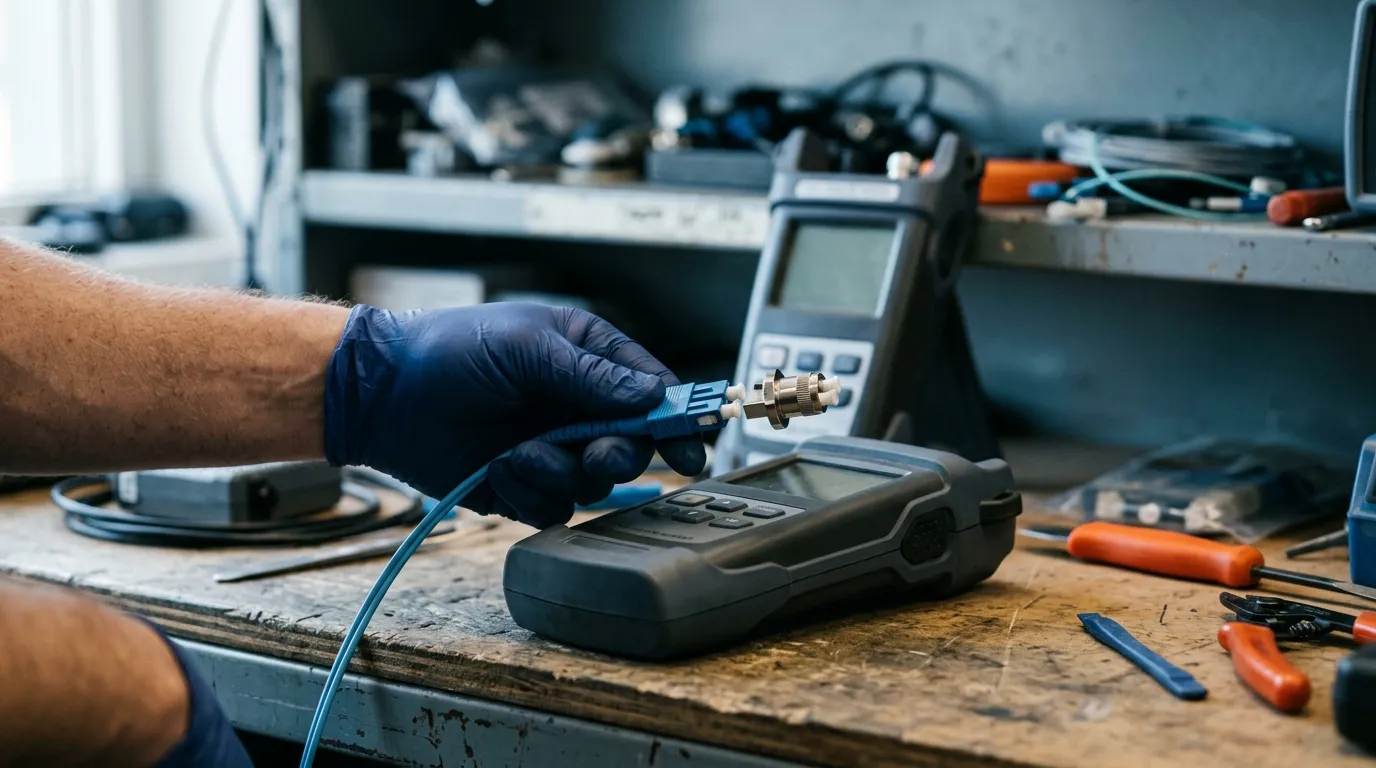
A few field rules that keep the number honest:
- Clean and inspect every end face before testing. A dirty reference cord contaminates the reference and can hide or fake several tenths of a dB.
- Use the right launch conditions for multimode. Testing 50/125 µm multimode without encircled-flux control can overfill or underfill the core and return results that do not match how the transceiver launches light.
- Test both directions on long or high-loss links if your test method requires it, and average if you are chasing a marginal result.
- Record wavelengths. Singlemode links are typically certified at 1310 nm and 1550 nm; multimode at 850 nm and 1300 nm.
The OLTS gives you one number for the whole link, which is exactly what the budget comparison needs — but it cannot tell you where a loss lives. That is the OTDR's job, covered next. If you want the full five-step field sequence — inspection, continuity, loss, OTDR, and documentation — our fiber optic cable testing guide walks through it end to end, and the FOA's fiber testing reference is the canonical industry background on Tier 1 and Tier 2 methods.
Finding Reflectance Events: What the OTDR Adds
An optical time domain reflectometer (OTDR) sends pulses down the fiber and watches what comes back, building a trace of loss against distance. It does two things the OLTS cannot: it locates individual events (splices, connectors, bends, breaks) and it shows their individual loss, and it measures reflectance at reflective events — the connectors, mechanical splices, and breaks that bounce light back.
If you need to know how to measure return loss on an installed link, the practical answer is: you do not get one link-level RL number from a Tier 2 trace; you get per-event reflectance. A sharp spike rising off the backscatter floor is a reflective event — a connector or mechanical splice — and its height, read in negative dB, is its reflectance (equivalently, a positive return loss). A fusion splice, by contrast, shows almost no spike because the glass is continuous; it appears as a small step of loss. That visual difference is why a trace full of tall spikes tells you the link is full of connectors or poorly made mechanical joints, and why an APC-only plant shows far smaller spikes than a UPC plant at the same event loss.
For total link reflectance you would use an ORL meter or an OTDR with ORL capability, but for day-to-day troubleshooting the per-event reflectance is the more useful number: it tells you which connector to go clean or re-terminate, not just that something is reflecting somewhere.
High Loss or Low Return Loss? The Field Fix Sequence
When a link fails its loss budget, or an OTDR trace shows a reflectance spike at a connector that should be quiet, the fix sequence is almost always the same — and it starts with the most boring possible suspect.
- Inspect. Put a scope on the end face. Magnified, most "mystery" losses turn out to be a speck of dust, an oil film, or a nick in the polish.
- Clean. Dry-clean with a click-type cleaner or lint-free wipe, then wet-clean with alcohol if needed, then dry again.
- Re-test. Measure the event or the link again. Contamination is the leading cause of both high insertion loss and low return loss in the field — one dirty end face can add 0.5 dB or more of loss and drop return loss by tens of dB.
- If the number does not move, the fault is physical: a bad cleave or arc on a splice, a damaged ferrule, an over-tight bend, or an APC-to-UPC mismatch from someone forcing incompatible polishes together. Fix the joint or re-terminate.

Inspect-clean-retest is cheap and fixes a large majority of field failures. The remaining minority — bad splices and damaged connectors — is exactly what the OTDR trace localizes for you, so you walk to the right panel instead of re-terminating the whole link.
Why Both Matter: A Worked Link Budget
Every fiber optic loss budget starts from the same formula:
Total link loss = (cable attenuation × distance) + (connector loss × number of mated pairs) + (splice loss × number of splices)
Run it with real numbers for a typical singlemode campus run: 2.0 km of OS2 cable, two patch panels (four mated pairs total counting the two ends), and two fusion splices.
Budget item | Value used | Contribution |
|---|---|---|
Cable, 2.0 km × 0.4 dB/km (1310 nm design allowance) | 0.8 dB | 0.8 dB |
4 mated connector pairs × 0.5 dB (typical design value) | 2.0 dB | 2.0 dB |
2 fusion splices × 0.1 dB | 0.2 dB | 0.2 dB |
Total loss budget | 3.0 dB |
If the OLTS measures 2.6 dB on the installed link, the link passes with 0.4 dB of margin — and you can stop there. If it measures 3.4 dB, the budget says fail, and the OTDR tells you why: a splice at 0.35 dB (over the 0.3 dB limit), or a connector pair at 1.1 dB (over the 0.75 dB ceiling). Re-splice the bad joint, or clean and re-seat the connector, and re-run the OLTS until the total is under budget. Splice acceptance and rework practice is covered step by step in our fiber splicing guide, and the FOA's loss budget reference shows the same math generalized to any link type.
Designers of high-speed data center links run the same arithmetic with tighter component grades and thinner margin — a 400G loss budget is this formula with harsher numbers. The logic never changes: count every mated pair and every splice, budget at worst-case values, and measure the installed result against the budget.
The 90-Second Decision Summary
- Insertion loss — the light that does not get through. Lower is better. Measure end-to-end with an OLTS; a mated pair should be 0.2–0.5 dB (0.75 dB max), a fusion splice 0.02–0.1 dB.
- Return loss — the light that comes back. Higher is better. Check it at the connector spec level (multimode ≥ 20 dB, singlemode PC ≥ 26 dB floor; UPC ≥ 50 dB, APC ≥ 60 dB typical) and watch reflectance events on the OTDR when troubleshooting.
- The link passes when measured insertion loss fits the budget — calculate it before you test, then compare, then use the OTDR only to locate what is over.
When you are ordering the components themselves, the numbers on the datasheet only mean something if the factory actually measures them. DYS Fiber Optic ships its patch cords, connectors, and MPO/MTP assemblies with per-cable insertion loss and return loss test data, measured on the IEC 61300-3-4 and IEC 61300-3-6 test methods — ask for the reports when you request samples. If you want to compare our numbers against your budget, talk to our engineering team — send us your link design and we will work the loss budget with you before you commit to a bill of materials.