
Fiber Basics
dB vs dBm in Fiber Optics: How to Read a Datasheet
dB measures a change. dBm measures a level. A loss column on a fiber datasheet is in dB because it describes what happened to the light between two points; a receiver sensitivity figure is in dBm because it describes an absolute amount of light at one point. Read the suffix first, and the confusion mostly clears: a negative dBm is not a bad signal, it is simply a signal below 1 mW.
That is the whole difference in two sentences. What follows is the part datasheets assume you already know — the four legal ways to combine these numbers, what a specified limit does and does not promise, and a 10 km access link worked line by line. It is the practical half of the dB vs dBm question in fiber optics: not what the units are called, but what a column of them on a sheet is allowed to mean.
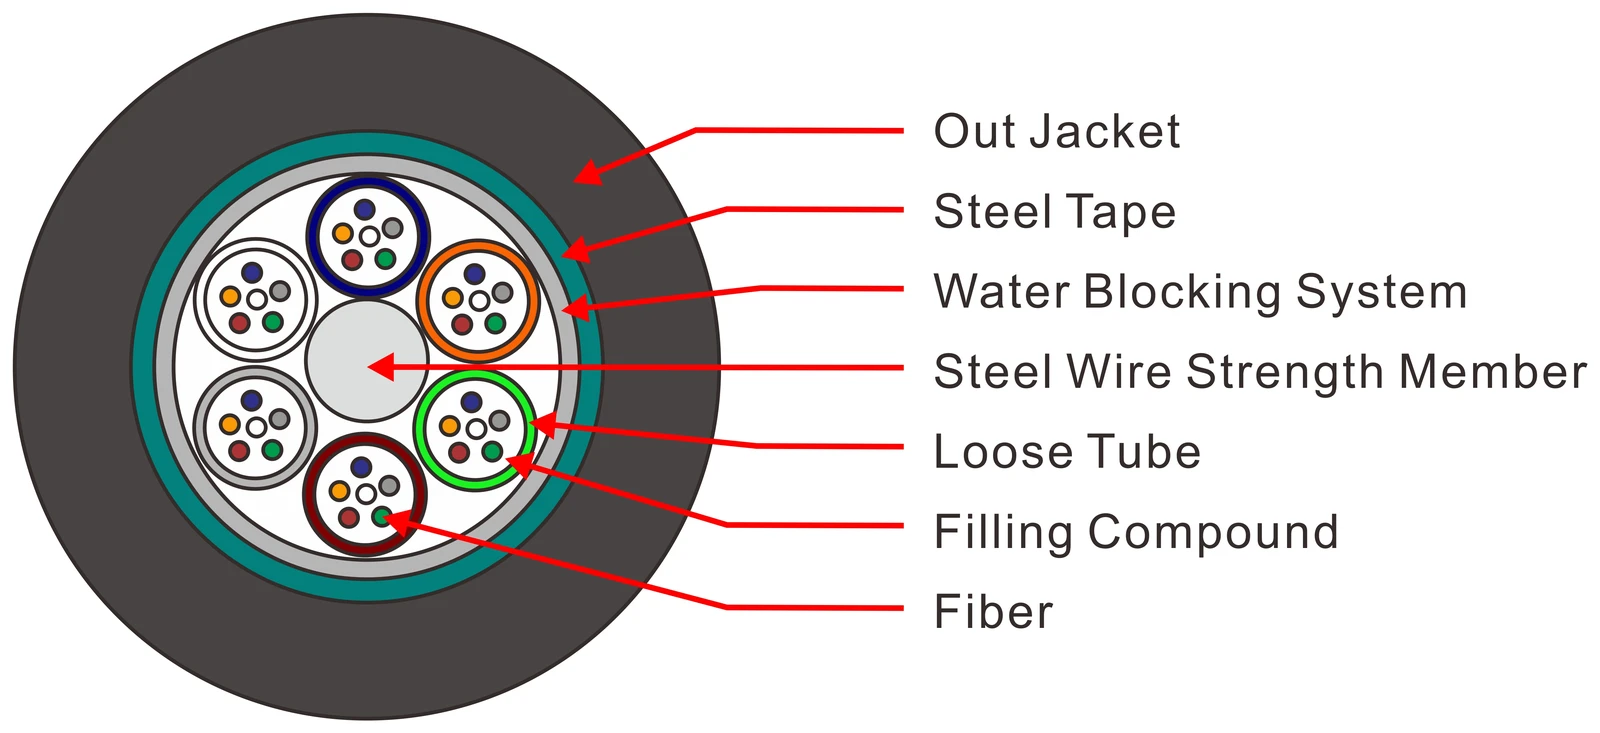
If you are still building the hardware picture — what is inside the cable, why glass loses light at all — the fiber basics guide covers that ground. This page stays on the numbers.
dB vs dBm in fiber optics: one measures a change, the other a level
A decibel is ten times the base-10 logarithm of a ratio. Two powers, one divided by the other, no unit of power anywhere in the answer. "3 dB of loss" tells you the light was halved; it tells you nothing about how much light there was. That is why a dB figure is always attached to a pair of points: insertion loss between two adapters, attenuation over a length of cable, the difference across a splice.
A dBm is ten times the base-10 logarithm of one power divided by a fixed 1 mW reference. Now the number is pinned to something physical. 0 dBm is exactly 1 mW; +10 dBm is 10 mW; −10 dBm is 100 µW. Two dBm values four dB apart are a factor of 2.5, wherever on the scale they sit.
Three log rules cover almost every field calculation you will do:
- +3 dB ≈ ×2. +3 dBm is 2 mW, not 3 mW.
- +10 dB = ×10. Ten times the power, exactly, because the scale is base 10.
- +1 dB ≈ ×1.26, and +0.1 dB ≈ ×1.023. This is the rule that matters commercially: 0.1 dB looks like nothing, and it is a 2.3% cut in power. Forty of those is nearly 4 dB — close to a seventh of a 28 dB PON budget — spent on splices nobody counted.
Negative dBm values fall out of the same arithmetic rather than signalling trouble. −20 dBm is 10 µW, −27 dBm is 2 µW. Those are the numbers a PON receiver works with all day, and it is perfectly content. The only thing a negative sign means is "below the 1 mW reference".
Two neighbours, for when a document mixes them in: dBW is the same idea referenced to 1 W, so dBW = dBm − 30, and dBi is antenna gain — a ratio, like dB, but about radiated field strength. Neither belongs on a fiber optic datasheet, but transceiver spec sheets carry RF heritage and sometimes print all four on one page.
Four arithmetic rules, and the one that is always wrong
Once the units are straight, the operations follow. There are exactly four, and they are not interchangeable:
Operation | Legal? | Result | Why |
|---|---|---|---|
dBm − dBm | Yes | dB | Two levels compared at two points = a loss or a gain |
dBm + dB | Yes | dBm | A level changed by a known loss is still a level |
dB + dB | Yes | dB | Losses in series add (0.3 + 0.3 = 0.6 dB across two connections) |
dBm + dBm | No | — | Two absolute levels cannot be added; convert to mW first if you truly need the sum |
The arithmetic is worth watching on a real measurement. A transmitter launches +3.0 dBm into a patch cord, the far end of the cord meets a bulkhead adapter, and a meter reads +2.7 dBm on the other side. The loss is 0.3 dB — a subtraction of two dBm values that yields a dB value. Then someone upstream writes "0.3 dB" on the drawing and the next engineer adds three of those together and gets 0.9 dB, because dB adds. Nobody in that chain had to know the original +3.0 dBm, and that is the point of expressing loss as a ratio.
The illegal operation shows up in one specific situation: adding two independent optical powers, such as two WDM channels landing on the same detector. You cannot add the dBm numbers. Convert both to mW (+3 dBm = 2.0 mW, 0 dBm = 1.0 mW), add them (3.0 mW), convert back (+4.8 dBm). Notice the answer is 1.8 dB above the stronger channel, not 3 dB — the assumption that two channels always add 3 dB only holds when they carry equal power, and equal power is the case nobody needs to look up.
What the number on a datasheet actually is
Here is where most field arguments start. A datasheet value and a meter reading are not the same kind of number, even when both are printed in dB.
A specification limit is a ceiling, not a measurement. When a sheet says "insertion loss ≤ 0.30 dB", it promises that no unit in the inspected population exceeds 0.30 dB under the stated test conditions. It does not say the typical unit is 0.30 dB; production clusters well below its own ceiling, and a well-run line usually publishes a limit with margin precisely because the mean is lower. Reading the ceiling as an expectation makes every budget pessimistic and every supplier look marginal.
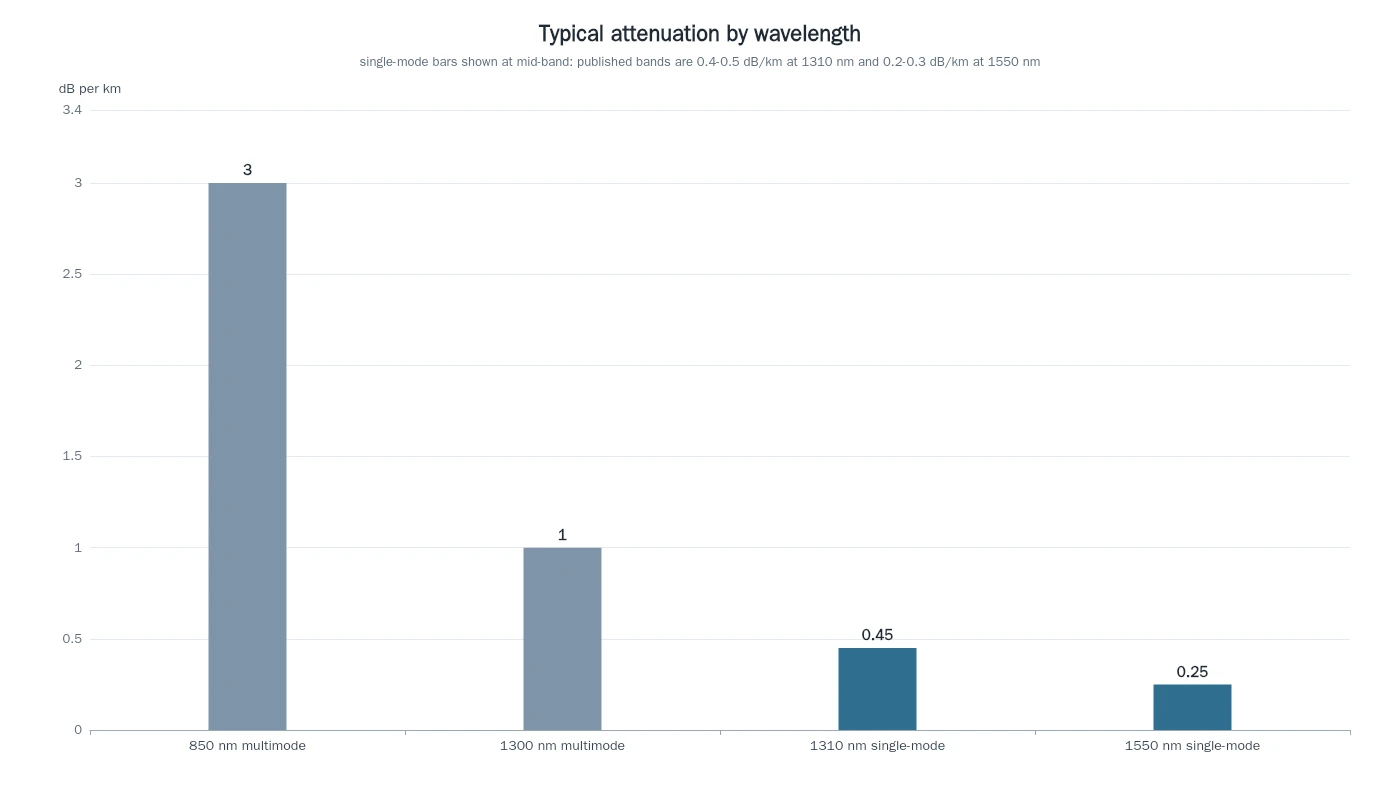
The wavelength travels with the number. Cable attenuation is quoted per kilometre at a stated wavelength and changes a lot across the window: multimode runs about 3.0 dB/km at 850 nm and 1.0 dB/km at 1300 nm, while single-mode sits around 0.4–0.5 dB/km at 1310 nm and 0.2–0.3 dB/km at 1550 nm, per the FOA's attenuation reference. A 10 km span is 4.0 dB at 1310 nm and 2.5 dB at 1550 nm — the same cable, the same length, a 1.5 dB difference. If a number arrives without its wavelength, you cannot compare it to anything, including another number from the same supplier.
A connector does not have a loss; a mated pair does. The FOA makes the distinction bluntly in its loss budget reference: connectors have no loss, only connections do. The dB on the sheet belongs to two ferrules in an adapter, and the measured value depends partly on the reference connector they were mated to. That is not a technicality — it is why the same jumper can measure differently against two different reference cords, and why connector loss is only meaningful together with the method used to test it.
The 0 dB reference decides what the number contains. Before any loss is measured, the test set is zeroed against a reference. Zero it with one reference cord and the connectors on both ends of the cable under test are inside the result; zero it with three cords (the method used for plug-and-jack interfaces such as MPO) and two connections are already subtracted, so the reported number is smaller. Both readings are correct, and they describe different things. That single fact explains a large share of "your report does not match my report" disputes.
Worst case already includes ageing. Standards write their limits as worst-case values over the operating range. ITU-T G.984.2, the GPON physical-media specification, states that its parameter values are worst-case and include ageing effects. So a 28 dB path-loss ceiling is not a fresh-install measurement with a comfortable margin on top — it is the outer boundary after years of temperature cycling.
And the calculated budget ignores measurement uncertainty. The FOA's own guidance says the calculated loss budget is an estimate from assumed component values and does not account for measurement uncertainty. Practically: without the test set's accuracy figure, treat sub-decibel differences between two reports as instrument noise rather than as a change in the plant.
The engineering consequences — which limit applies to a mated pair, and how return loss is specified separately — are covered in insertion loss vs return loss.
Reading a link budget line by line
Take a 10 km feeder into a 1:32 splitter, the shape of a small PON build. Every line is a dB value, and the only dBm values are at the two ends.
Line | Basis | dB |
|---|---|---|
Fiber, 10 km at 1310 nm | 0.40 dB/km | 4.0 |
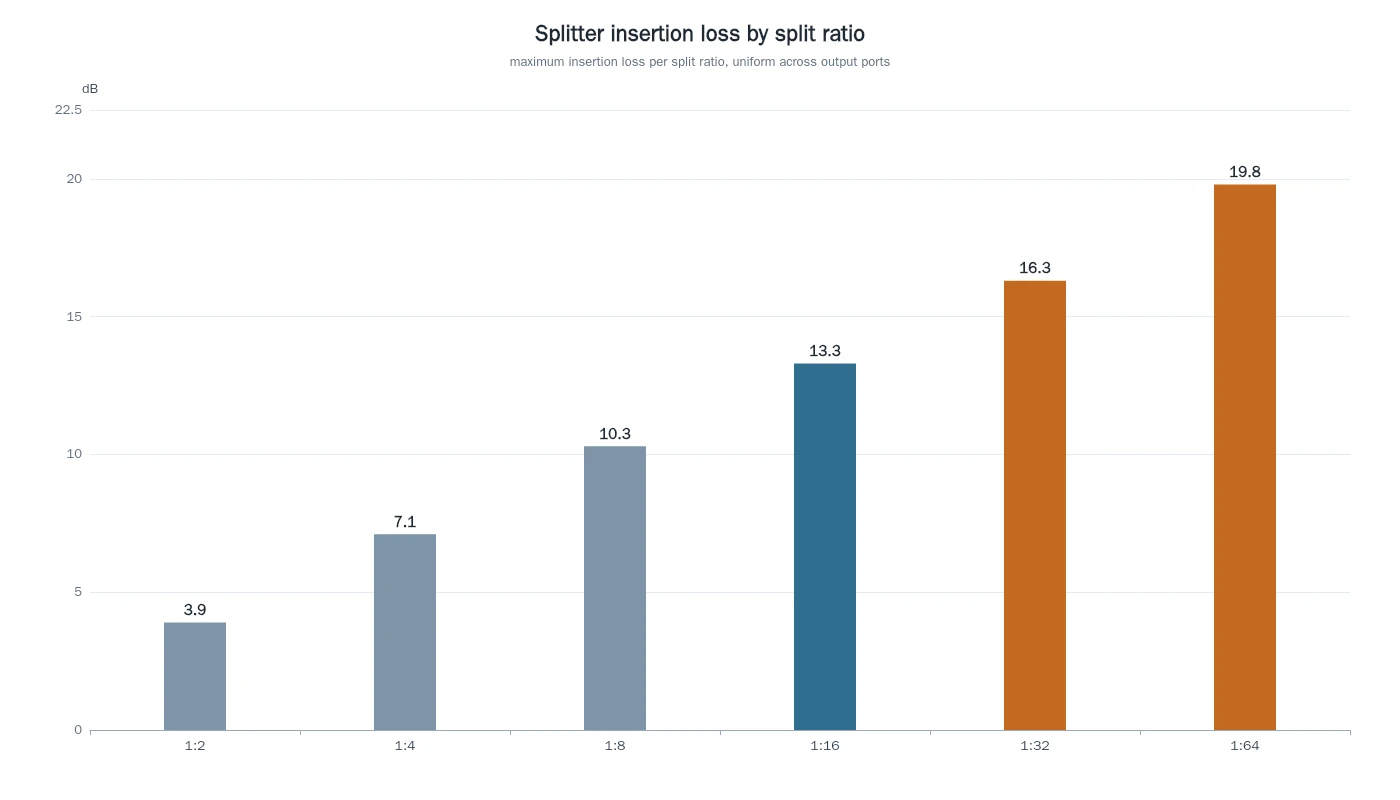
1:32 PLC splitter | ≤16.3 dB, plus 1.5 dB worst-port uniformity | 17.8 |
4 fusion splices | 0.1 dB planned each | 0.4 |
2 mated connections | 0.3 dB each | 0.6 |
Design margin | ageing, repairs, temperature | 3.0 |
Total plant loss | 25.8 |
Note the planning values rather than the ceilings: single-mode fusion splices typically land under 0.05 dB, so 0.1 dB each is deliberately conservative, and 0.3 dB per mated connection sits well inside the 0.75 dB that TIA-568 permits for premises connections. Conservative component values are how a budget survives contact with a real build.
Now the levels. An OLT port specified at +3 dBm launches into that plant, and the total loss is subtracted:
+3.0 dBm − 25.8 dB = −22.8 dBm at the receiver input, in the design case.
The receiver sensitivity is −27 dBm at a bit error ratio of 1 × 10⁻¹⁰, the design objective G.984.2 sets its limits against, so the link arrives 4.2 dB above the threshold where it stops working. The power budget is the other direction of the same subtraction: +3 dBm − (−27 dBm) = 30 dB of dynamic range, of which the plant consumes 25.8 dB.
A budget is a window, not a floor. The same receiver also has an upper limit, and the counter-intuitive part is that it too sits below the 1 mW reference: ITU-T G.984.2 gives class B+ a minimum overload of −8 dBm at both the OLT and the ONU, against −28 and −27 dBm sensitivity — roughly 20 dB of usable range, with sensitivity as the floor and overload as the ceiling. A link short enough to land above that overload needs an attenuator rather than a shorter cable. The FOA's loss budget guidance makes the same point from the other side: too much loss breaks the link, too little can overload the detector.
That margin line deserves a second look, because the 3 dB in the table is not a physical loss on day one. Strip it out and the expected plant loss is 22.8 dB, which puts the receiver near −19.8 dBm on a new build; the 3 dB is the room reserved for ageing, repairs and temperature swings. The difference between "what it will measure today" and "what it must still work at in ten years" is what the margin buys, and only the second number belongs in a specification argument.
The class matters more than the arithmetic here. ITU-T G.984.2 gives GPON class B+ a maximum path loss of 28 dB, and that ceiling already includes ageing. Our 25.8 dB total sits 2.2 dB under it — the margin line is inside the 28 dB, not stacked on top. Add a further 3 dB of your own margin above a 28 dB limit and you have designed a 31 dB link that no B+ port is specified to close, even though the spreadsheet says it works.
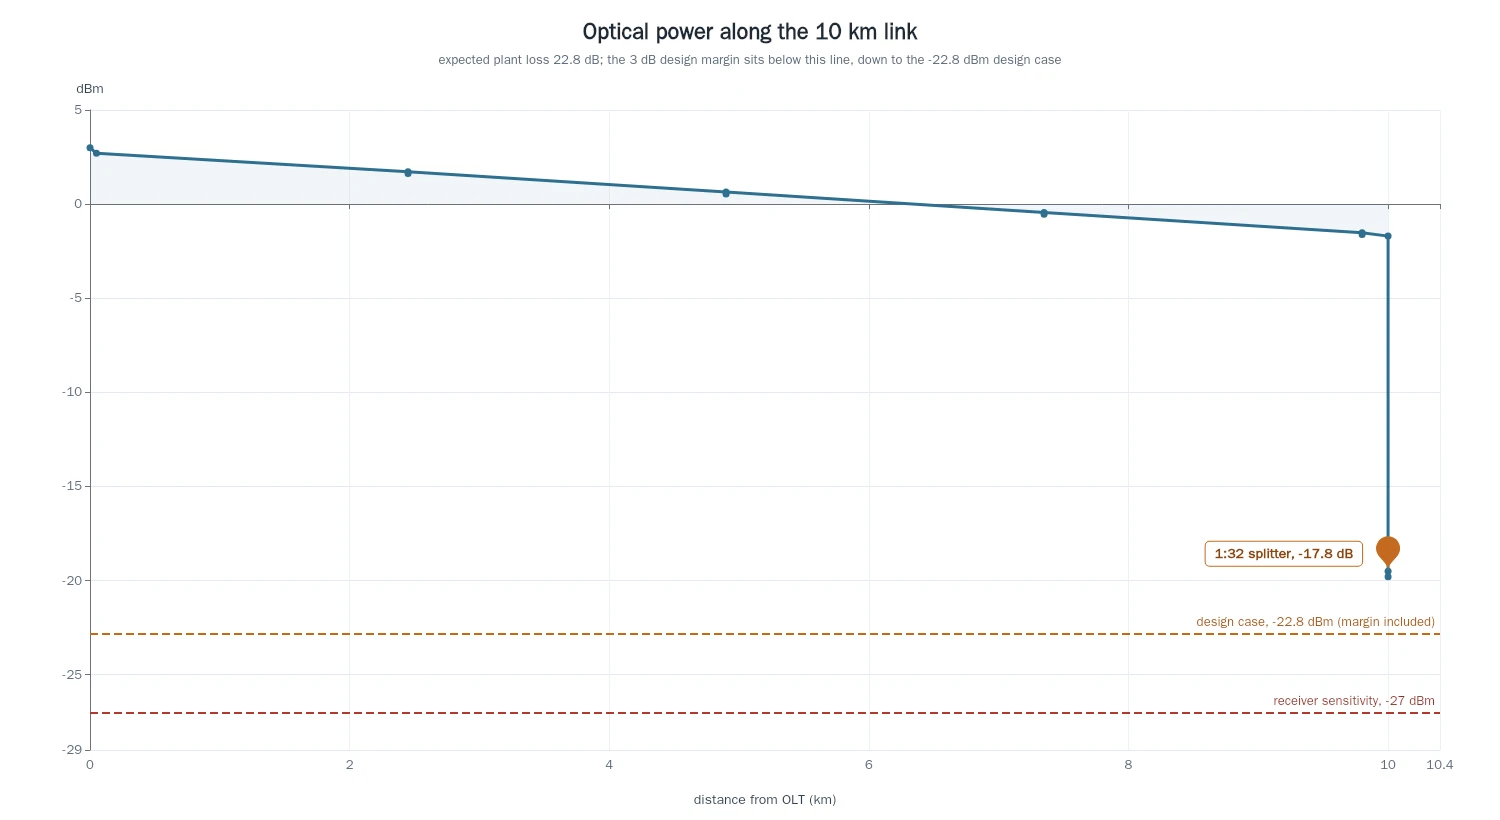
The splitter is where most of the loss lives, and where a ratio change does the most damage: moving from 1:32 to 1:64 adds about 4 dB on the worst port, four times the whole splice and connection budget. Split ratios and their measured insertion losses are set out in the PLC splitter guide.
Where each unit shows up on the bench
The instruments follow the same split, which is a useful way to check your own readings.
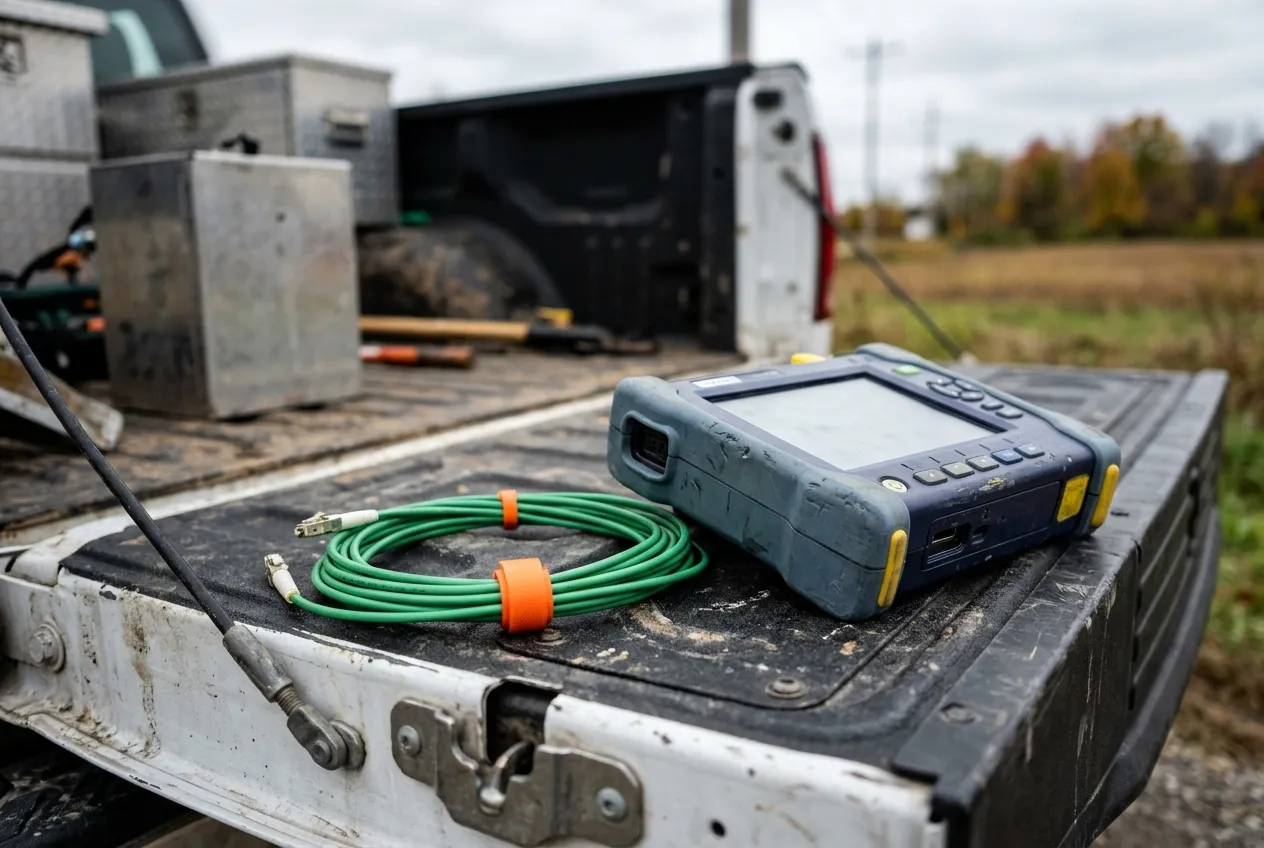
A power meter displays dBm, because it is measuring an absolute level arriving at its detector. It has to be told the wavelength, since the detector's responsivity changes across the window. A loss test set — a source and a meter used together — displays dB, because the number is the difference between the reference reading and the reading through the plant. An OTDR shows both: the vertical axis of the trace is backscatter power in dBm, while each event (a splice, a connector, a bend) is annotated as a dB loss and the slope between events as dB/km.
The order of operations therefore matters. Zero the meter against the reference cord first, or the dB number will contain a connector you did not intend to measure. On an OTDR, set the correct fiber type, wavelength and launch conditions before reading event losses, or the dB values will be consistently offset in a way that looks like a plant problem. Instrument procedure is covered in how to test fiber optic cable.
Six readings that go wrong in practice
- Adding two dBm values. +3 dBm and 0 dBm do not combine to +3 dBm: 2.0 mW plus 1.0 mW is 3.0 mW, which is +4.8 dBm. Convert to mW whenever two independent sources land on the same detector.
- Treating −20 dBm as a weak signal. It is 10 µW, absolute, and a receiver specified to −27 dBm is comfortable there. Whether a level is good depends on the receiver, not on the sign.
- Mixing in dBW or dBi. A transceiver sheet quoting "0 dBW output" is quoting 30 dBm. An antenna gain in dBi has nothing to do with optical loss.
- Counting the end connections twice. The budget includes them; a three-cable-reference test already subtracts two. Subtract both and you have built in a phantom 0.6 dB of loss.
- Comparing numbers from different wavelengths. 4.0 dB and 2.5 dB can describe the same 10 km of the same cable at 1310 nm and 1550 nm.
- Reading a ceiling as typical. The TIA-568 limit of 0.75 dB per mated connection is a compliance boundary, not a design value; use it in a budget and every link will appear to fail before it is even built.
Quick reference: dBm to mW in the fiber window
dBm | mW | Where you meet it |
|---|---|---|
+5 | 3.16 | High-power OLT port, class C+ territory |
+3 | 2.00 | Typical GPON OLT launch |
0 | 1.00 | The reference point, by definition |
−3 | 0.50 | Half a milliwatt |
−10 | 0.10 | 100 µW |
−20 | 0.010 | 10 µW, comfortable receiver level |
−23 | 0.005 | 5 µW |
−27 | 0.002 | 2 µW, class B+ sensitivity |
−30 | 0.001 | 1 µW |
−40 | 0.0001 | 0.1 µW, near the edge for most access optics |
Values rounded to three significant figures; 1 mW = 0 dBm is the fixed definition, the rest follows from 10 × log₁₀(P / 1 mW). The same definition, taken beyond fiber, is set out on the dBm reference page.
What to ask a supplier for
A datasheet tells you the ceiling. What you actually need to close a budget is the distribution underneath it, and that is a request you can make in one sentence.
Ask for four things with any cable or assembly order: the measured insertion loss per unit or per batch, not only the limit; the wavelength used for those measurements; the test method and reference used to zero the set; and the sample basis — how many units were measured and how many failed. Anyone quoting a limit without those four is quoting a promise rather than data, and the way to write all four into an enquiry is covered in how to spec fiber optic cable in an RFQ.
The pattern to insist on is described in what to demand in a per-shipment test report.
DYS tests every order before shipment — in-process QC, outgoing inspection and traceability records are standard — and test reports can be provided on request, with measured attenuation per assembly and the test wavelength and method stated, so the ceiling on the datasheet and the numbers in the box can be compared line by line. If you are building a budget and want the measured figures for a specific cable or assembly, our engineers can send the report for the batch in question.
The habit worth keeping is the one this page opened with: read the suffix before you read the number. dB tells you what changed between two points, dBm tells you what is present at one point, and a datasheet is a set of ceilings that a measurement is supposed to sit underneath.